Plotting the invariant mass histogram
Contents
Plotting the invariant mass histogram#
In this excercise, we learn how to plot the histogram of invariant masses with Python. Let us use the data collected by the CMS detector in 2011 [1]. Events with specific criteria [2] have been selected in the CSV file Ymumu_Run2011A.csv, which we are using.
Explore the different code cells below and run the code. Note that normally the code would not be commented as much as this. Here, the reason for these comments is to explain in detail what the code is doing.
[1] CMS collaboration (2016). DoubleMu primary dataset in AOD format from RunA of 2011 (/DoubleMu/Run2011A-12Oct2013-v1/AOD). CERN Open Data Portal. DOI: 10.7483/OPENDATA.CMS.RZ34.QR6N.
[2] Thomas McCauley (2016). Ymumu. Jupyter Notebook file. https://github.com/tpmccauley/cmsopendata-jupyter/blob/hst-0.1/Ymumu.ipynb.
1) Start#
# Import the needed modules. Pandas is for the data-analysis
# and matplotlib.pyplot for making plots. Modules are named as pd and plt.
import pandas as pd
import matplotlib.pyplot as plt

# Jupyter Notebook uses "magic functions". With this function it is possible to plot
# the histogram straight to notebook.
%matplotlib inline
2) Getting the data#
# Create a new DataFrame structure from the file "Ymumu_Run2011A.csv"
dataset = pd.read_csv('../../Data/Ymumu_Run2011A.csv')

# Create a Series structure (basically a list) and name it "invariant_mass".
# Save the column "M" from the "dataset" to the variable "invariant_mass".
invariant_mass = dataset['M']
3) Plotting the histogram#
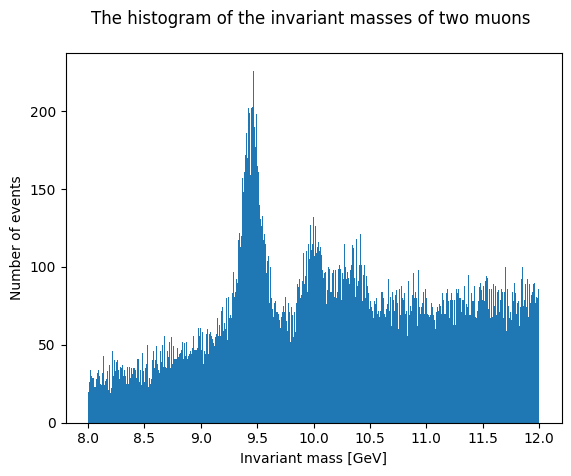
Now we can create and plot the histogram of the values of the invariant masses. The histogram shows for how many events the invariant mass of the muon pair is in a certain value range. Note that we will use total 500 bins in the histogram, so you will not spot the separate bins because there are so many of them.
# Plot the histogram with the function hist() of the matplotlib.pyplot module:
# (http://matplotlib.org/api/pyplot_api.html?highlight=matplotlib.pyplot.hist#matplotlib.pyplot.hist).
# 'Bins' determines the number of bins used.
plt.hist(invariant_mass, bins=500)

# Name the axises and give a title.
plt.xlabel('Invariant mass [GeV]')
plt.ylabel('Number of events')
plt.title('The histogram of the invariant masses of two muons \n') # \n creates a new line for making the title look better

# Show the plot.
plt.show()
4) Analysis#
What does the histogram tell us?
What happens around the mass 9.5 GeV?